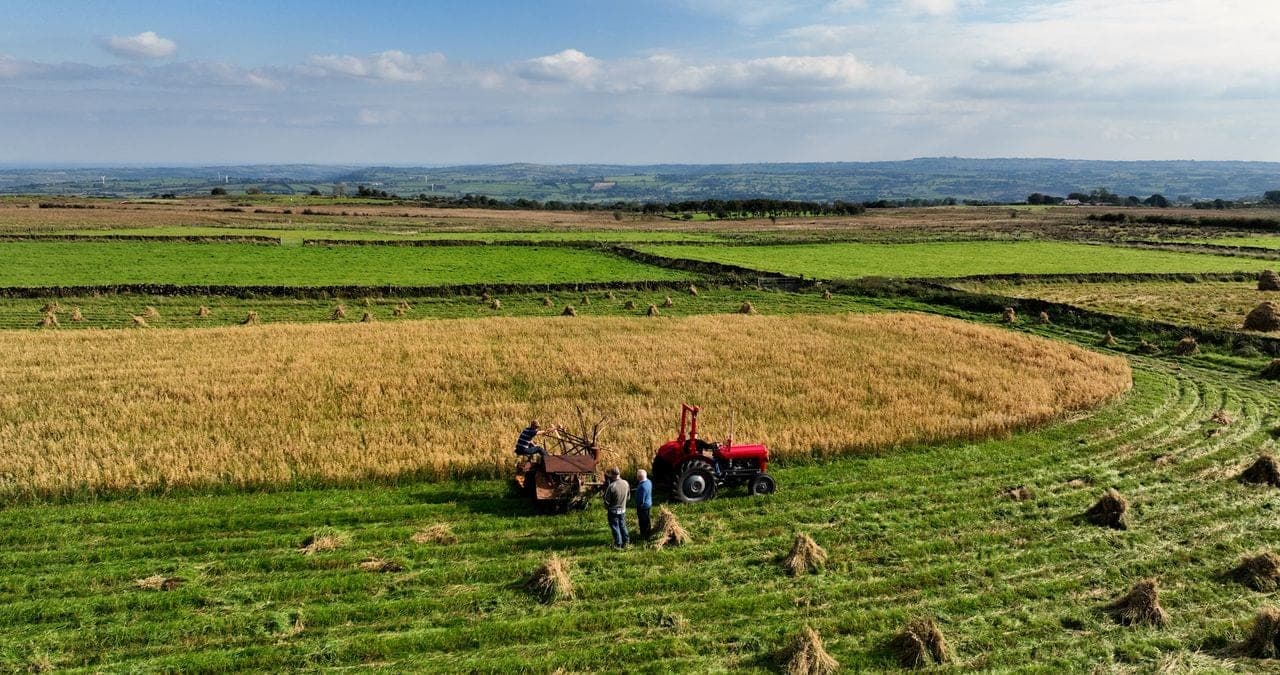
Photo: Peter Steele / Pexels
Everything we eat grows in a thin layer of soil. Building three centimetres of it takes a thousand years. Losing a football pitch of it takes five seconds.
Almost everything you have ever eaten grew in the top few dozen centimetres of the ground. Below that is rock, and nothing grows in rock. About a tenth of the planet's land surface is under crops, and that tenth feeds all of us.
That soil is not shared out evenly between countries, and it is not replaced as fast as we lose it. Over a human lifetime it is not replaced at all.
Share of the world land surface under crops
World Bank indicator AG.LND.ARBL.ZS, compiled from FAO data, 2021. Arable land is land under temporary crops, meadows, market gardens and land left fallow under five years.
- Under crops11%
- Everything else - desert, mountain, forest, ice, cities89%
Why soil is not like other resources
FAO's own summary from its global symposium on soil erosion has one sentence in it that puts everything else in order:
It can take up to 1 000 years to produce just 2-3 cm of soil.
Now set that against the rate we lose it.
The arithmetic of topsoil
Figures from FAO, Global Symposium on Soil Erosion key messages, and FAO SOLAW 2021 facts and figures.
1,000 yrs
to produce 2 to 3 centimetres of soil
5 sec
in which we lose the equivalent of one football pitch of soil
20-37bn
tonnes of topsoil carried away by erosion each year
How much of what we eat comes from soil
FAO, Global Symposium on Soil Erosion key messages.
- Grown in soil95%
- Everything else - fisheries and aquaculture5%
A third of the world's soil is already moderately to highly degraded, according to FAO, and the same body warns that over 90 per cent could be degraded by 2050. Erosion on its own, FAO says, can take up to half the crop yield on affected land.
The bill does not stop at food. FAO's Director-General put the climate side of it in one line in 2022: the degradation of the world's soils has already released up to 78 gigatonnes of carbon into the atmosphere.
The good land is already being farmed
Good farmland was never shared out evenly. It is the work of parent rock, glaciers, river silt and thousands of years of climate — none of which humans arranged, and none of which they can repeat in a hurry.
FAO's assessment of global land and water resources found that some 1.6 billion hectares of the world's best, most productive land is already under crops. Whatever room is left to expand into is not where the good soil is.
The world's farmland
Arable land as a share of national land area, 2021.
 VOTVS
Share of land under crops (%)
Source: World Bank indicator AG.LND.ARBL.ZS, compiled from FAO data. Equal Earth projection.
votvs.com
This is a measure of land use, not soil quality. A low share can mean desert, mountain or forest as easily as poor ground — Suriname is near the bottom because it is rainforest.
Which is why the last century's gains in food were not a story about new land:
Cropland versus production, 1961 to 2009
FAO, State of the World's Land and Water Resources for Food and Agriculture, as reported by FAO newsroom, 2011. Percentage growth over the period.
- Growth in world cropland area12%
- Growth in agricultural production150%
Cropland grew 12 per cent. Output grew 150 per cent. The gap between those two numbers is fertiliser, irrigation, breeding and machinery, and most of it was drawn against the soil rather than added to it.
Good soil without water is not good farmland
FAO's 2021 land and water report contains one more split, and it decides as much as the soil does:
Rainfed and irrigated farming: land used and food produced
FAO, SOLAW 2021 facts and figures.
- Rainfed - share of cultivated land80%
- Rainfed - share of world food produced60%
- Irrigated - share of cultivated land20%
- Irrigated - share of world food produced40%
A fifth of the cultivated land produces two fifths of the food, because there the water arrives on demand rather than when it rains. Agriculture already takes 72 per cent of all surface and groundwater withdrawn worldwide. Soil and water are not two separate questions: good soil without water is still poor ground.
The countries that cannot grow what they eat
Soil decides who grows and who buys. A country short of arable land does not eat less bread; it goes out to the world market to buy it. And that market is not a crowd of sellers.
Russia alone is forecast to export 46 million tonnes of wheat in 2026/27, out of a world total of about 214 million tonnes, according to the US Department of Agriculture, with the European Union, Canada and Australia behind it. The bread of everyone who cannot grow their own passes through a handful of suppliers.
Five countries take the largest share of what those sellers ship.
The largest wheat importers
USDA Foreign Agricultural Service, Grain: World Markets and Trade, August 2026, forecast for marketing year 2026/27. The European Union imports at a comparable scale but is a bloc, not a country, and is left out here.
- Egypt13m tonnes
- Indonesia12.5m tonnes
- Algeria8.5m tonnes
- Brazil7.5m tonnes
- Philippines7.1m tonnes
Set that list beside the map and two stories fall out of it, not one.
Egypt and Algeria are there because of the land. They have among the smallest shares of cropland in the world: 3.1 per cent of Egypt is arable, 3.2 per cent of Algeria. The rest is desert. No price and no policy changes that.
Indonesia, Brazil and the Philippines are a different story. They are not short of farmland: Brazil is one of the world's agricultural giants, and the Philippines has nearly a fifth of its territory under crops. But wheat is a temperate crop and these are tropical countries whose people now eat bread and noodles. Brazil grows soy at a scale that moves world prices and still buys its flour abroad.
So the same queue at the same sellers holds countries that cannot grow wheat and countries that simply do not. From a distance the two look like one problem. Only one of them has a solution.
Egypt stands at the front of that queue. The USDA forecasts imports of 13 million tonnes for 2025/26 against domestic production of 9.3 million tonnes and total consumption of 20.4 million.
Egypt wheat supply: imported versus home-grown
USDA Foreign Agricultural Service, Grain and Feed Annual, Egypt, marketing year 2025/26. Imports 13.0 million tonnes, domestic production 9.3 million tonnes.
- Imported58%
- Grown in Egypt42%
Where that wheat comes from is the second half of the exposure. Over the past five years Egypt's largest suppliers were Russia, Ukraine and the EU: three origins gathered around one sea.
Egypt wheat imports by origin, five-year total
USDA Foreign Agricultural Service, Grain and Feed Annual, Egypt, 2025. Volumes over the preceding five years.
- Russia34.6m tonnes
- Ukraine10.4m tonnes
- European Union9.64m tonnes
Nor is the bread left to the market. Egypt runs one of the world's largest food subsidy programmes: the USDA reports that around 66.7 per cent of Egyptians are eligible, each entitled to five subsidised loaves a day, at a cost of roughly 98 billion Egyptian pounds — about $2.03 billion — for the bread subsidy alone in financial year 2024/25.
Two thirds of a country of over a hundred million people eat bread whose wheat is mostly grown on somebody else's land and comes to them across one sea.
That is what a soil map means when you follow it far enough. It is not a ranking of countries by the quality of their ground. It is a map of who eats from their own land and who has to trust somebody else's.
Where the data is, if you want to check any of this
Two datasets sit behind most global soil maps you will ever see, and both are public.
The FAO/UNESCO Soil Map of the World is the landmark. FAO and UNESCO decided to make it in 1961, and by FAO's own account it was completed over a span of twenty years at a scale of 1:5,000,000. FAO's page for it says it "remained until recently the only global overview of soil resources." It is a monumental piece of work and it is also, now, a historical document.
The current one is the Harmonized World Soil Database, whose version 2.0 was revised and released in September 2023 at 1 km resolution. If you see a soil map published today, that is what it should be built from.
Both are free to download. That matters, because soil maps get shared widely and simplified badly on the way: a global soil classification describes soil types, it does not grade farmland. Any map that turns the first into the second is making a judgement, and it owes you its working.
What it comes down to
Soil quality is inherited, not chosen. It is the work of rock, ice, rivers and climate over spans that make farming itself look like a recent hobby, and no country picked its own share.
That part is nobody's fault. The rest is a policy question, and it comes with numbers you can check: a third of what we have is already degraded, three more centimetres takes up to ten centuries, and we are losing it right now at a football pitch every five seconds.
- How long does it take for soil to form?
- FAO states that it can take up to 1,000 years to produce just 2 to 3 centimetres of soil. On any human timescale, topsoil is not a renewable resource.
- How much of the world's soil is degraded?
- FAO puts it at 33 per cent — a third of the world's soil is moderately to highly degraded — and warns that over 90 per cent could be degraded by 2050.
- How much of our food depends on soil?
- FAO says 95 per cent of the food we eat comes from the soil.
- Which country imports the most wheat?
- Egypt. The USDA forecasts Egyptian wheat imports of 13 million tonnes in 2025/26, against domestic production of 9.3 million tonnes and consumption of 20.4 million — so most of the wheat Egypt eats is grown somewhere else. Indonesia is second at about 12.5 million tonnes, followed by Algeria, Brazil and the Philippines.
- Why does Brazil import wheat when it is an agricultural giant?
- Because wheat is a temperate crop and most of Brazil is not. Having excellent land for soy, maize and coffee does not make a country able to grow wheat, which is why several large agricultural exporters are also large flour importers.
- Which datasets do global soil maps come from?
- Most trace back to the FAO/UNESCO Soil Map of the World, begun in 1961 and completed over twenty years, or to its modern successor the Harmonized World Soil Database, whose version 2.0 was released in September 2023 at 1 km resolution. Both are published by FAO and free to download.
Every figure above comes from the sources below, as they reported it, on the date given.
- 01Global Symposium on Soil Erosion — key messages
Food and Agriculture Organization of the United Nations
- 02
- 03
- 04Scarcity and degradation of land and water: growing threat to food security
FAO newsroom, on the State of the World's Land and Water Resources report — 2011
- 05Grain and Feed Annual, Egypt
USDA Foreign Agricultural Service, GAIN report EG2025-0009 — 2025
- 06Grain: World Markets and Trade
USDA Foreign Agricultural Service — August 2026
- 07FAO/UNESCO Soil Map of the World
FAO Soils Portal
- 08Harmonized World Soil Database v2.0
FAO Soils Portal
Facts verified against these sources on 9 September 2026